Visuals
The Opportunity Zone
One qualifying tract, a decade of proof: the evidence base for renewing Hallandale Beach's federal Opportunity Zone designation.
When the federal Opportunity Zone program was renewed, Hallandale Beach faced a narrowed map: Census Tract 1003.02 became the only remaining eligible tract in the city. That concentration raised the stakes on a single application — the city needed a rigorous, defensible evidence base to justify renewal.
BusinessFlare® built that evidence base. We assembled a consolidated findings report and a full project pipeline inventory for Tract 1003.02, drawing on CoStar property analytics, ESRI Business Analyst demographics, Lightcast labor-market data, and parcel-level verification — the raw material for the city's Master Application and its supporting economic-impact narrative.
The 2018 designation worked. Roughly 541,000 square feet of commercial and residential space was delivered inside Tract 1003.02 after it was designated — anchored by a 286,000 SF Class A office tower — and that capital is now recycling. On top of delivered product, BusinessFlare® identified more than $1.2 billion in committed and proposed capital across 14 named projects, giving the renewal application concrete, verifiable proof that incentive-driven investment flows into this tract.
Four workstreams that together form the city's renewal evidence base for Tract 1003.02.
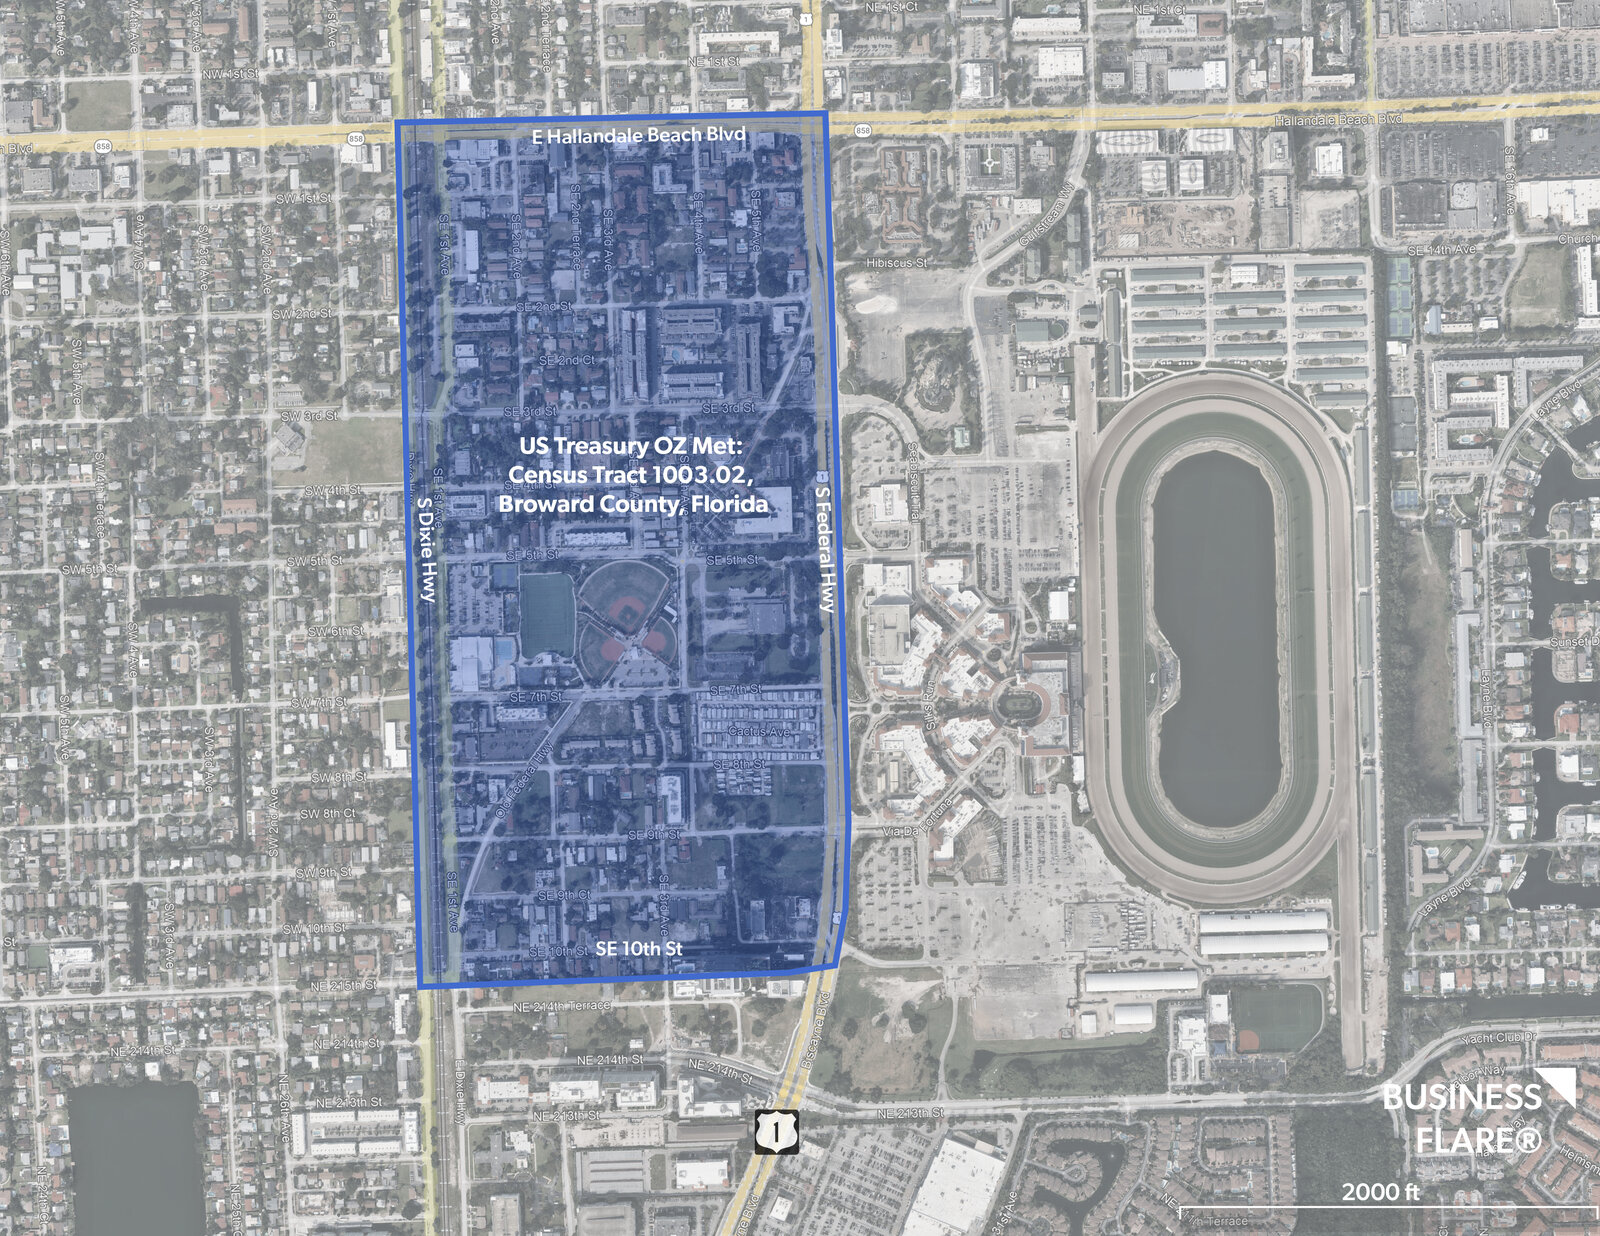
Tract 1003.02 is the sole remaining eligible Opportunity Zone tract in Hallandale Beach, running the US-1 / South Federal Highway corridor through the city's downtown core. We mapped its precise Treasury-recognized boundaries and framed the renewal case around a single, concentrated, high-impact zone.
We inventoried every real-estate project recently delivered, under construction, approved, proposed, or in pre-development within or adjacent to the tract — organized by status with developer, size, value, and sourcing — separating true in-tract projects from adjacent activity to keep the application defensible.
Using a saved tract polygon in CoStar, we pulled aggregate and property-level data across multifamily, retail, office, and industrial — capturing vacancy, pricing, absorption opportunity, and active construction.
We ran ESRI Business Analyst classic reports for the tract — community profile, business summary, civilian labor force, and Tapestry segmentation — and layered in county-level Lightcast labor-market data as an economic backdrop, documenting the methodology transparently.
Because a renewal application must withstand scrutiny, we confirmed each project's parcel relationship to the tract boundary, separated in-tract from adjacent activity, and documented data caveats so the city submits only defensible figures.